Project Explorer
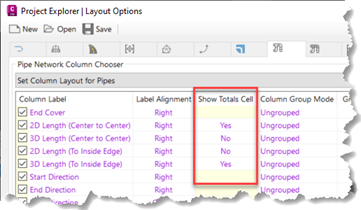
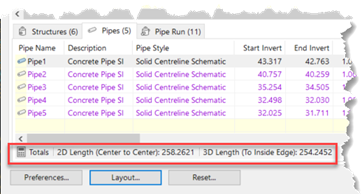
For reports and tables, there is a new option to add totals for rows and columns. You can also choose which totals to display in the object tab.
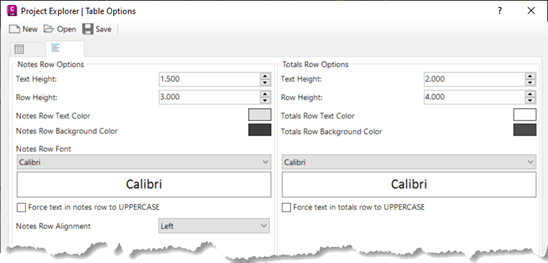
For AutoCAD tables, the row height and text size are customizable for data and total rows independently.
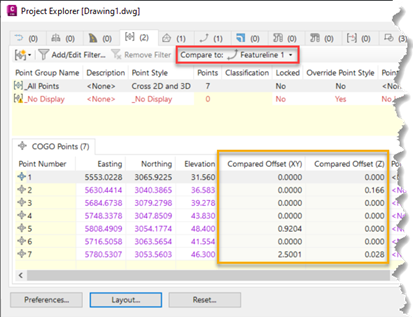
The ‘Compare To’ feature now includes the possibility to compare COGO points and parcels to feature lines.
Grading Optimization
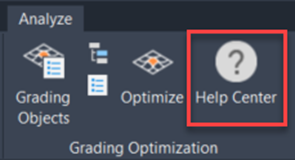
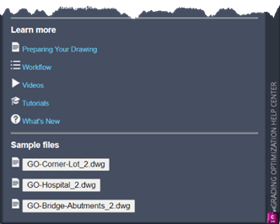
The new ‘Help Center’ provides quick access to the help system, including workflows, videos, tutorials, and sample files. It can be opened from the Analyze tab of the ribbon or from the Grading Optimization window.
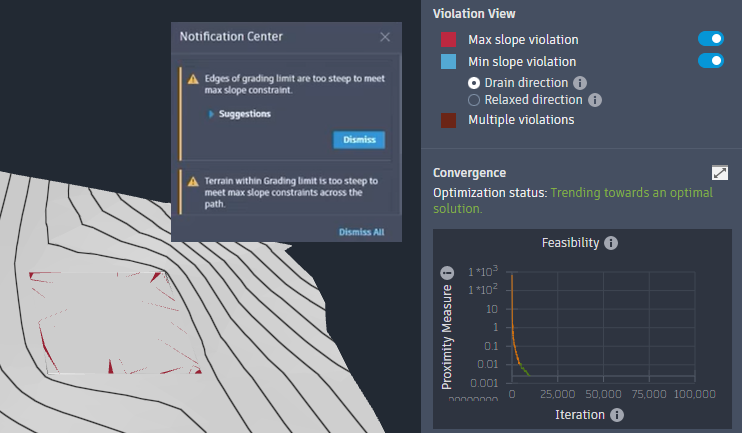
There are new ways to keep track of the optimization process. The progress bar has been enhanced to include the steps that are required prior to the optimization taking place, like the preparation of the model or the precheck.

Additional visual guidelines are provided to better display the optimization process and the ‘Notification Center’ has been introduced to offer supplementary information, such as conflicts between the constraints.